

| Met Office Hadley Centre observations datasets |
| > Home > HadAT > |
These graphics files are crown copyright. Please let us know when you use them and for what purposes so that subsequent improvements can be made optimally. They are not an exhaustive list of all possible diagrams. Each plot in these graphics pages is presented as an automatically generated (low resolution) png image, but a link to a postscript version more suitable for most purposes is also provided.
|
|
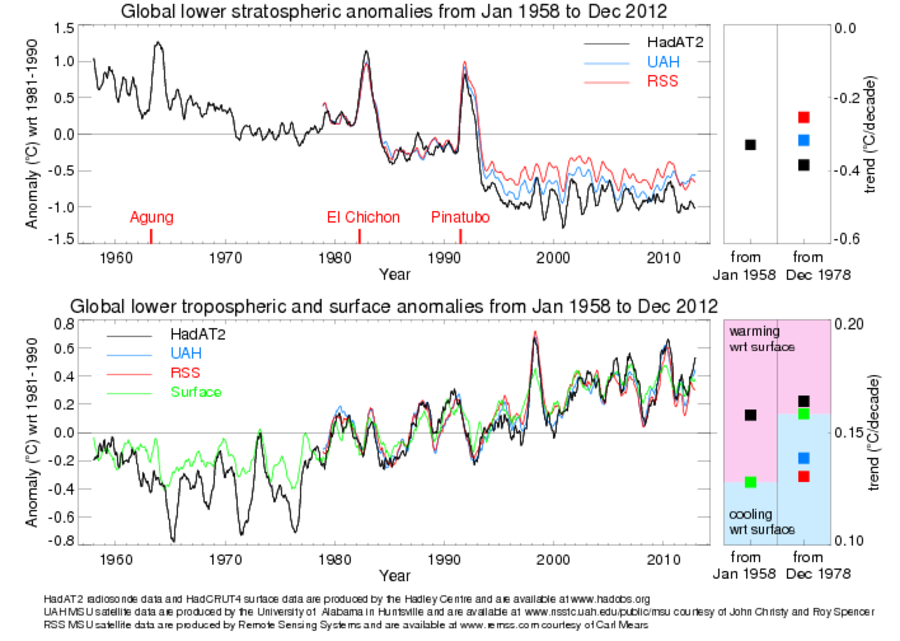
| Figure 1: Global lower stratospheric and lower tropospheric temperature anomalies from satellites and radiosondes. | Figure 2: Tropical (20S-20N ) lower stratospheric and lower tropospheric temperature anomalies from satellites and radiosondes. |
| Full size png | Full size png |
| Full size postscript | Full size postscript |
UAH (blue) and RSS (red) are two independently produced satellite estimates based on the same Microwave Sounding Units (MSU) temperature retrievals. HadAT (black) has been vertically weighted to create an MSU-equivalent time series and the surface (green) temperature anomalies are based on HadCRUT3. All data have been smoothed using a simple 7-point filter. The squares on the right hand panels denote the trends for the radiosonde and satellite eras, calculated using a median of pairwise slopes approach. The blue/pink areas on the tropospheric plot highlight tropospheric cooling/warming relative to the surface. Theoretical expectations are for greater warming in the troposphere than at the surface in the tropics.
Commercial and media enquiriesYou can access the Met Office Customer Centre, any time of the day or night by phone, fax or e-mail. Trained staff will help you find the information or products that are right for you. |
 |
Maintained by: Holly Titchner |
© Crown Copyright
|