


| Met Office Hadley Centre observations datasets |
| > Home > HadAT > |
The plots below were produced from the HadAT2 monthly product. They are updated in near-real-time at the same time as the dataset. These graphics files are crown copyright. Please let us know when you use them and for what purposes so that subsequent improvements can be made optimally. They are not an exhaustive list of all possible diagrams. Each plot is presented here as a png image, but a link to a postscript version more suitable for most purposes is also provided.
|
|
|
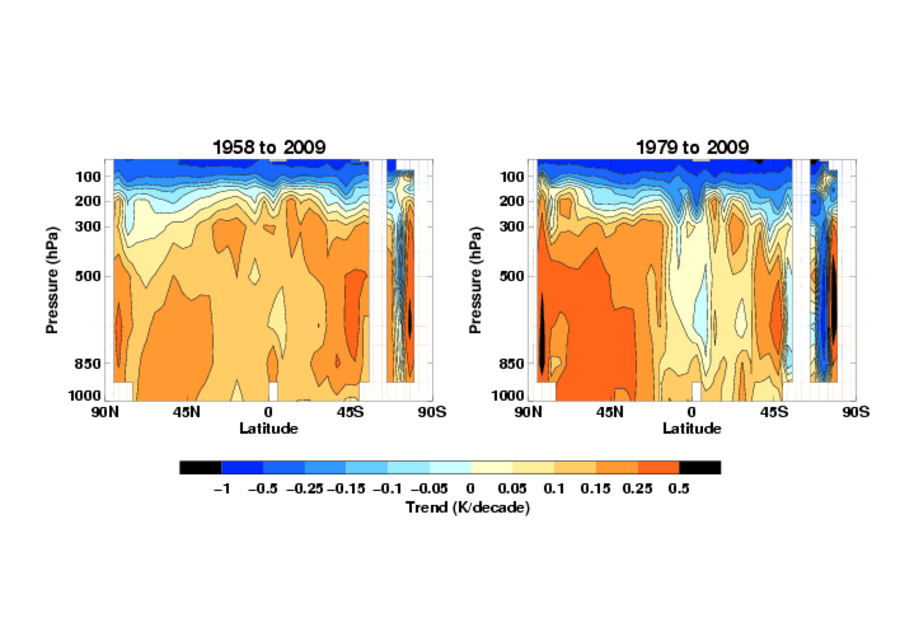
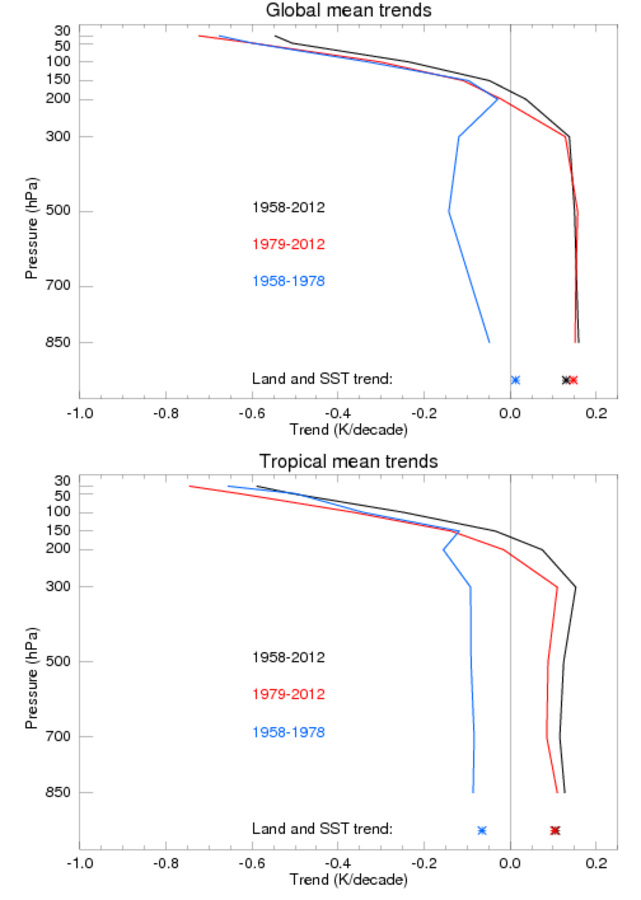
| Zonal trends plot (K/decade) | Global and tropical trends plot (K/decade) | Global mean timeseries plot at 500 and 100hPa (K) |
| Full size png | Full size png | Full size png |
| Full size postscript | Full size postscript | Full size postscript |
|
|
|
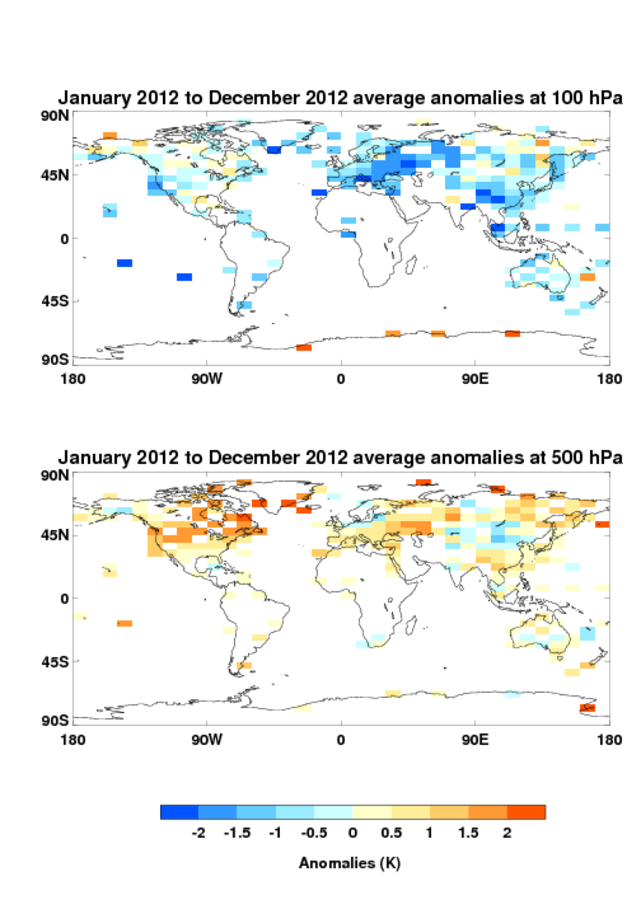
| Last months fields at 500 and 100hPa (K) | Last months zonal-mean anomaly field (K) | Last years fields at 500 and 100hPa (K) |
| Full size png | Full size png | Full size png |
| Full size postscript | Full size postscript | Full size postscript |
|
|
|
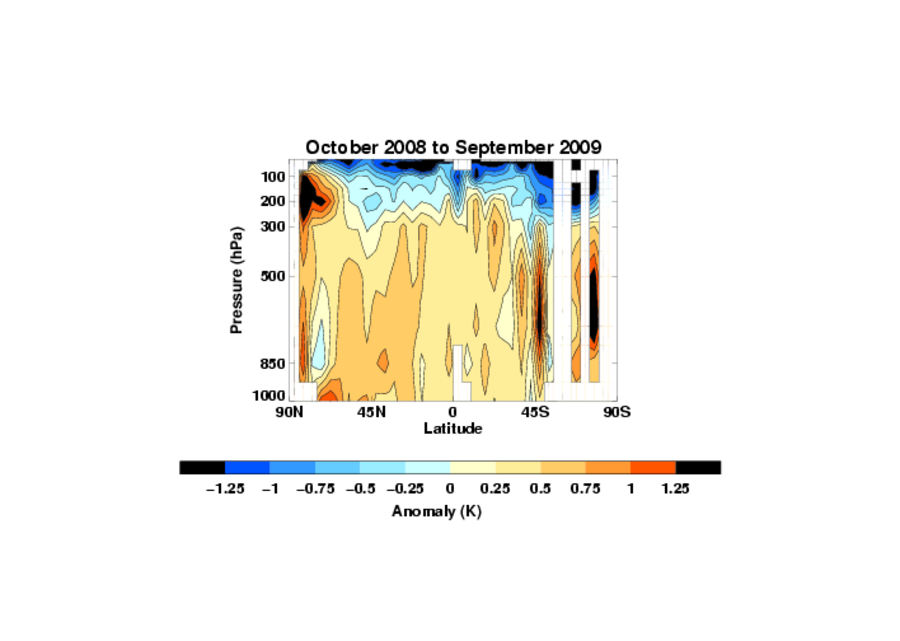
| Last years zonal-mean anomaly field (K) | Station attendance by WMO region at 500hPa (with logarithmic attendance axis) | MSU equivalent global mean timeseries plot (K) |
| Full size png | Full size png | Full size png |
| Full size postscript | Full size postscript | Full size postscript |
Commercial and media enquiriesYou can access the Met Office Customer Centre, any time of the day or night by phone, fax or e-mail. Trained staff will help you find the information or products that are right for you. |
 |
Maintained by: Holly Titchner |
© Crown Copyright
|