| Met Office Hadley Centre observations datasets |
| > Home |
|
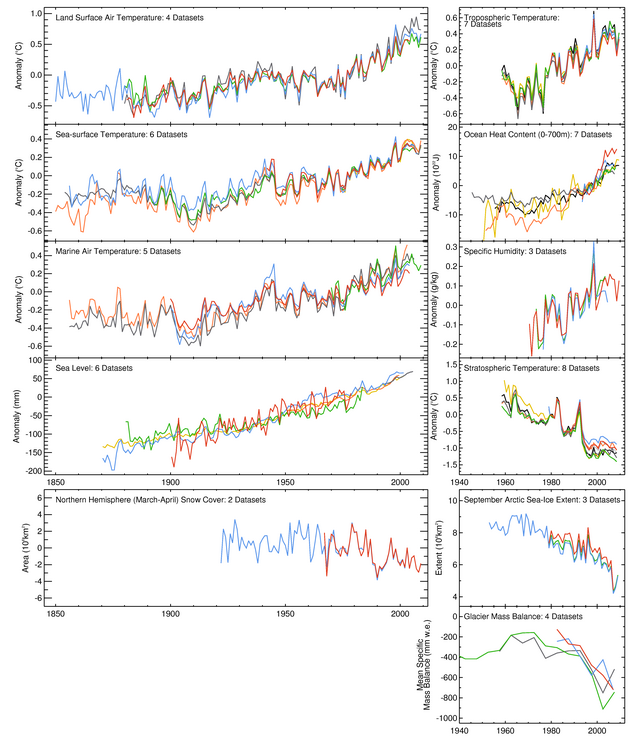
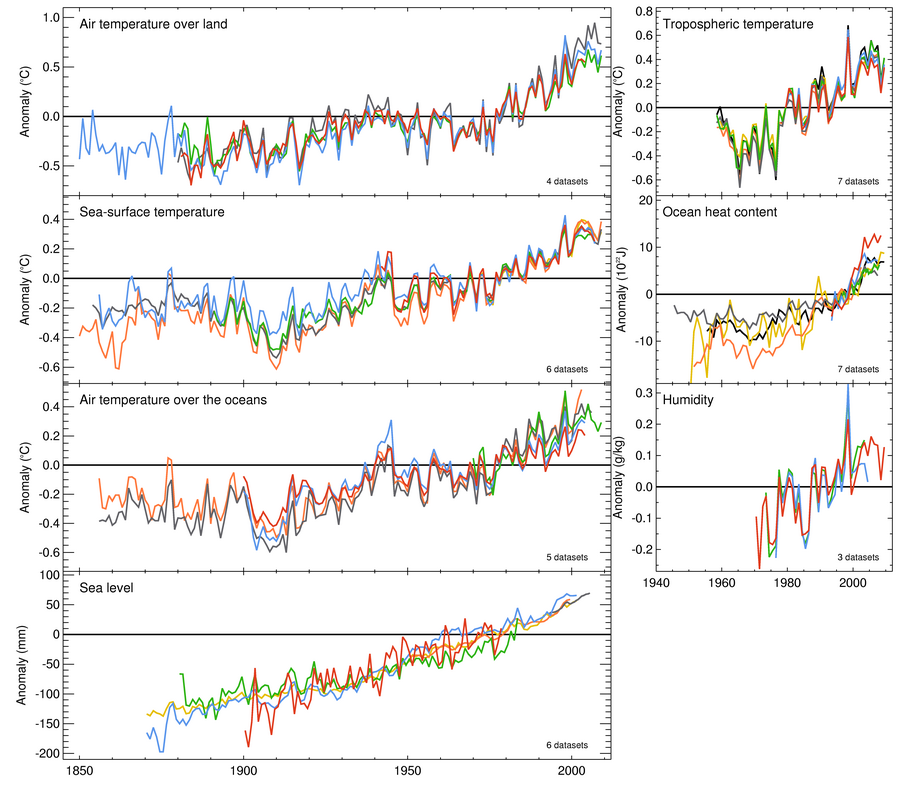
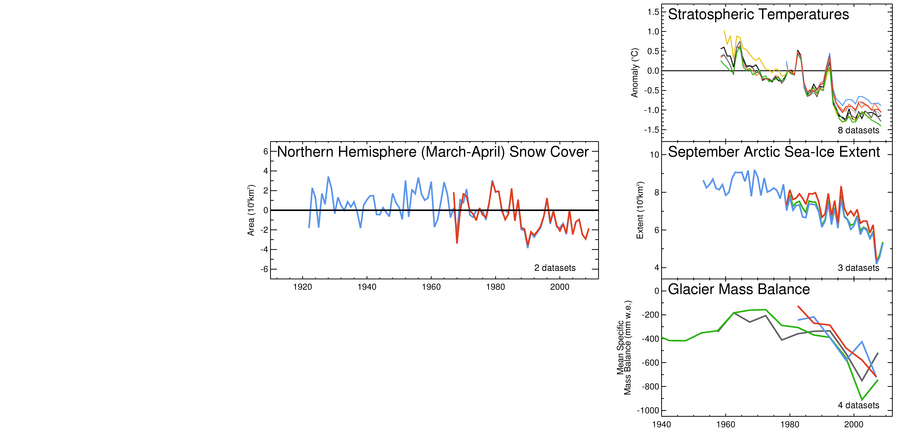
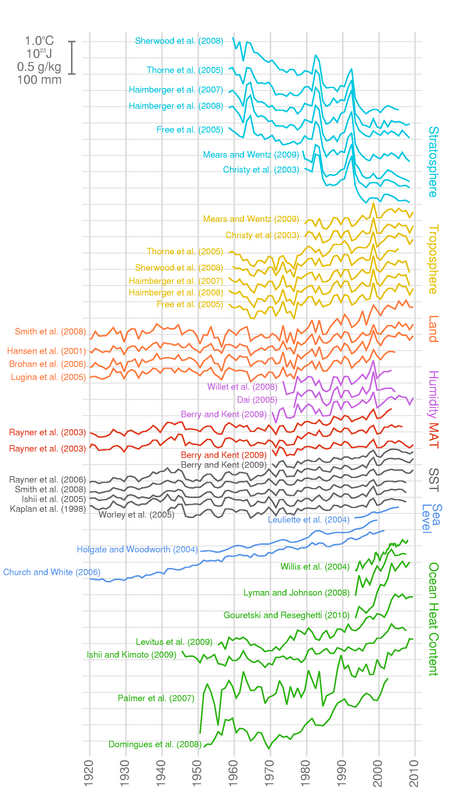
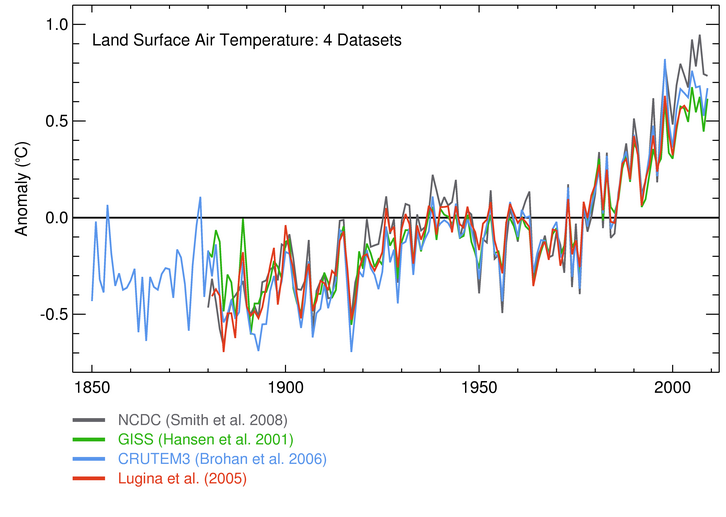
The 11 indicators shown below have been compiled by the Met Office Hadley Centre for this purpose. They draw on the work of over 100 scientists from more than 20 institutions and provide, in one place, a holistic view of our climate from the depths of the oceans to the high atmosphere. Each indicator is expected to be strongly correlated with surface temperatures and for each one, multiple analyses are shown. Multiple analyses indicate which features of the series are not sensitive to the exact choice of analysis method and might be considered robust features of the climate. In the long-term, seven of the indicators are rising and four are declining. Each of the indicators is consistent with the land surface temperature records and shows long-term warming.
The indicators were published in the
BAMS State of the Climate 2009 report.
If you use these images please acknowledge the source as the Met Office Hadley Centre and reference: The data are provided for documentary purposes only. If you wish to use the data in your analysis please contact the authors of the papers for the original series. Details are given in each data file. Many are publically available on the web. |
CRUTEM3, Brohan et al. (2006)
NASA GISS, Hansen et al. (2001)
Lugina et al. (2005)
NOAA NCDC, Smith et al. (2008)
Five weather balloon data sets
HadAT2, Thorne et al. (2005)
IUK, Sherwood et al. (2008)
RAOBCORE, Haimberger et al. (2007)
RATPAC, Free et al. (2005)
RICH, Haimberger et al. (2008)
and two satellite data sets
RSS, Mears and Wentz (2009a,b)
UAH, Christy et al. (2003)
COBE, Ishii et al. (2005)
ERSSTv3, Smith et al. (2008)
HadSST2, Rayner et al. (2006)
ICOADS, Worley et al. (2005)
Kaplan et al. (1998)
SOC, Berry and Kent (2010)
HadMAT, Rayner et al. (2003)
Ishii et al. (2005)
Ishii et al. (2005)
MOHMAT, Rayner et al. (2003)
SOC, Berry and Kent (2010)
Domingues et al. (2008)
Ishii et al. (2009)
Willis et al. (2004)
Lyman and Johnson (2008)
Palmer et al. (2007)
NODC, Levitus et al. (2009)
Gouretski and Reseghetti (2010)
Church and White (2006)
Gornitz and Lebedeff (1987)
Holgate and Woodworth (2004)
Jevrejeva et al. (2006)
Leuliette et al. (2004)
Trupin and Wahr (1992)
Dai (2006)
HadCRUH, Willett et al. (2008)
SOC, Berry and Kent (2010)
HadAT2, Thorne et al. (2005)
IUK, Sherwood et al. (2008)
RAOBCORE, Haimberger et al. (2007)
RATPAC, Free et al. (2005)
RICH, Haimberger et al. (2008)
RSS, Mears and Wentz (2009a,b)
STAR, Zou et al. (2009)
UAH, Christy et al. (2003)
Comiso (1999)
HadISST, Rayner et al. (2003)
Fetterer et al. (2002)
Cogley (2009)
Cogley (2009), interpolated
WGMS (all glaciers)
WGMS (reference glaciers)
Brown (2000)
Robinson and Frei (2000)
Berry, D.I. and E.C. Kent, 2009: A New Air-Sea Interaction Gridded Dataset from ICOADS with Uncertainty Estimates. Bulletin of the American Meteorological Society, 90(5), 645-656 (DOI: 10.1175/2008BAMS2639.1).
Brohan, P., J.J. Kennedy, I. Harris, S.F.B. Tett and P.D. Jones, Uncertainty estimates in regional and global observed temperature changes: a new dataset from 1850. J. Geophys. Res, 111, D12106, doi:10.1029/2005JD006548. http://hadobs.metoffice.com/crutem3/diagnostics/global/nh+sh/annual
Brown, R.D., 2000: Northern hemisphere snow cover variability and change, 1915-97. J. Clim., 13, 23392355.
Christy JR, Spencer RW, Norris WB, Braswell WD, Parker DE. 2003. Error estimates of version 5.0 of MSU-AMSU bulk atmospheric temperatures. J. Atmos. Oceanic Technol. 20: 613-629.
Church, J.A., and N.J. White, 2006: A 20th century acceleration in global sea-level rise. Geophys. Res. Lett., 33, L01602, doi:10.1029/2005GL024826.
Cogley J.G. (2009): Geodetic and direct mass-balance measurements: comparison and joint analysis. Annals of Glaciology 50(50) 96-100.
Comiso, J. 1999, updated 2008. Bootstrap Sea Ice Concentrations from NIMBUS-7 SMMR and DMSP SSM/I, 1979-2007. Boulder, Colorado USA: National Snow and Ice Data Center. Digital media. http://nsidc.org/data/nsidc-0079.html
Dai, A., 2006: Recent Climatology, Variability, and Trends in Global Surface Humidity. J. Climate, 19, 3589-3606.
Domingues C.M., J.A. Church, N.J. White, P.J. Gleckler, S.E. Wijffels, P.M. Barker and J.R. Dunn, 2008. Improved estimates of upper-ocean warming and multi-decadal sea-level rise, Nature 453 1090-1093, doi:10.1038/nature07080
Fetterer, F., K. Knowles, W. Meier, and M. Savoie. 2002, updated 2009. Sea Ice Index. Boulder, Colorado USA: National Snow and Ice Data Center. Digital media. http://nsidc.org/data/docs/noaa/g02135_seaice_index/index.html ftp://sidads.colorado.edu/DATASETS/NOAA/G02135/Sep/
Free M, Seidel DJ, Angell JK, Lanzante JR, Durre I, Peterson TC. 2005. Radiosonde Atmospheric Temperature Products for Assessing Climate (RATPAC): A new dataset of large-area anomaly time series. J. Geophys. Res. 110: D22101-, DOI:10.1029/2005JD006169
Gornitz V, Lebedeff S. 1987. Global sea-level changes during the past century. In Sea-level Fluctuation and Coastal Evolution, Nummedal D, Pilkey OH, Howard JD (eds). The Society for Sedimentary Geology: Tulsa, Oklahoma; 316, (SEPM Special Publication No.41).(1987)
Gouretski V. and F. Reseghetti 2010. On depth and temperature biases in bathythermograph data: development of a new correction scheme based on the analysis of global ocean data. Deep Sea Res. submitted.
Haimberger L, Tavolato C, Sperka S. 2008. Towards elimination of the warm bias in historic radiosonde temperature records - some new results from a comprehensive intercomparison of upper air data. J. Climate 21: 4587-4606.
Haimberger L. 2007. Homogenization of radiosonde temperature time series using innovation statistics. J. Climate 20: 1377-1403.
Hansen, J., R. Ruedy, M. Sato, M. Imhoff, W. Lawrence, D. Easterling, T. Peterson, and T. Karl, 2001: A closer look at United States and global surface temperature change. J. Geophys. Res. 106, 23947-23963. http://data.giss.nasa.gov/gistemp/tabledata/GLB.Ts.txt
Holgate, S.J., and P.L. Woodworth, 2004: Evidence for enhanced coastal sea level rise during the 1990s. Geophys. Res. Lett., 31, L07305, doi:10.1029/2004GL019626.
Ishii, M., A. Shouji, S. Sugimoto, T. Matsumoto 2005: Objective analysis of SST and marine meteorological variables for the 20th Century using ICOADS and the Kobe Collection. Int. J. Climatol., 25, 865879. http://ghrsst.nodc.noaa.gov/intercomp.html
Ishii, M. and M. Kimoto, 2009: Reevaluation of Historical Ocean Heat Content Variations with Time-varying XBT and MBT depth bias corrections. J. Oceanogr., 65, 287-299.
Jevrejeva S, Grinsted A, Moore JC, Holgate SJ. 2006. Nonlinear trends and multiyear cycles in sea level records. Journal of Geophysical Research 111: C09012, DOI: 10.1029/2005JC003229.
Kaplan, A., M. Cane, Y. Kushnir, A. Clement, M. Blumenthal, and B. Rajagopalan, Analyses of global sea surface temperature 1856-1991, Journal of Geophysical Research, 103, 18,567-18,589, 1998. http://ghrsst.nodc.noaa.gov/intercomp.html
Leuliette, E.W., R.S. Nerem, and G.T. Mitchum, 2004: Calibration of TOPEX/Poseidon and Jason altimeter data to construct a continuous record of mean sea level change. Mar. Geodesy, 27(12), 7994.
Levitus S., J. I. Antonov, T. P. Boyer, R. A. Locarnini, H. E. Garcia, and A. V. Mishonov, 2009. Global ocean heat content 19552008 in light of recently revealed instrumentation problems GRL, 36, L07608, doi:10.1029/2008GL037155. http://www.nodc.noaa.gov/OC5/3M_HEAT_CONTENT/ ftp://ftp.nodc.noaa.gov/pub/data.nodc/woa/DATA_ANALYSIS/3M_HEAT_CONTENT/DATA/basin/yearly/h22-w0-700m.dat
Lugina, K.M., P.Ya. Groisman, K.Ya. Vinnikov, V.V. Koknaeva, and N.A. Speranskaya 2005: Monthly surface air temperature time series area-averaged over the 30-degree latitudinal belts of the globe, 1881-2004. In: Trends: A Compendium of Data on Global Change. Carbon Dioxide Information Analysis Center, Oak Ridge National Laboratory, US Department of Energy, Oak Ridge, TN, http://cdiac.esd.ornl.gov/trends/temp/lugina/lugina.html
Lyman, J.M. and G.C. Johnson, 2008: Estimating annual global upper ocean heat content anomalies despite irregular in situ ocean sampling. J. Clim. 21 5629-5641.
Mears CA, Wentz FJ. 2009a. Construction of the RSS V3.2 lower tropospheric temperature records from the MSU and AMSU microwave sounders. J. Atmos. Ocean. Tech . (submitted).
Mears CA, Wentz FJ. 2009b. Construction of the Remote Sensing Systems V3.2 atmospheric temperature records from the MSU and AMSU microwave sounders. J. Atmos. Ocean. Tech. 26: 1040-1056.
Palmer M. D., K. Haines, S. F. B. Tett and T. J. Ansell (2007), Isolating the signal of ocean global warming, Geophys. Res. Lett., 34, L23610, doi:10.1029/2007GL031712.
Palmer, M., J. Antonov, P. Barker, N. Bindoff, T. Boyer, M. Carson, C. Domingues, C., S. Gille, P. Gleckler, S. Good, V. Gouretski, S. Guinehut, K. Haines, D. E. Harrison, M. Ishii, G. Johnson, S. Levitus, S. Lozier, J. Lyman., A. Meijers, K. von Schuckmann, D. Smith, S. Wijffels and J. Willis, 2010: Future observations for monitoring global ocean heat content, in Proceedings of the OceanObs09: Sustained Ocean Observations and Information for Society Conference (Vol. 2), Venice, Italy, 21-25 September 2009, Hall, J., Harrison D.E. and Stammer, D., Eds., ESA Publication WPP-306, 2010.
Rayner NA, Parker DE, Horton EB, Folland CK, Alexander LV, Rowell DP, Kent EC, Kaplan A. 2003. Global analyses of sea surface temperature, sea-ice and night marine air temperature since the late nineteenth century. J. Geophys. Res. (Atmospheres) 108(D14): 4407-, DOI:10.1029/2002JD002670
Rayner, N.A., P.Brohan, D.E.Parker, C.K.Folland, J.J.Kennedy, M.Vanicek, T.Ansell and S.F.B.Tett 2006: Improved analyses of changes and uncertainties in sea surface temperature measured in situ since the mid-nineteenth century: the HadSST2 data set. Journal of Climate. 19(3) pp. 446-469. http://hadobs.metoffice.com/hadsst2/diagnostics/global/nh+sh/annual
Reynolds R.W., T. M. Smith. Improved global sea surface temperature analyses.. J. Climate 7, 1994
Robinson, D.A. and A. Frei. 2000: Seasonal variability of northern hemisphere snow extent using visible satellite data. Professional Geographer , 51, 307-314.
Sherwood SC, Meyer CL, Allen RJ, Titchner HA. 2008. Robust tropospheric warming revealed by iteratively homogenized radiosonde data. J. Climate 21: 5336-5350.
Smith, T.M., R.W. Reynolds, Thomas C. Peterson, and Jay Lawrimore 2008: Improvements to NOAA's Historical Merged Land-Ocean Surface Temperature Analysis (1880-2006). Journal of Climate, 21, 2283-2293. http://www.esrl.noaa.gov/psd/data/gridded/data.noaa.ersst.html http://www.ncdc.noaa.gov/oa/climate/research/anomalies/index.html NOAA_ERSST_V3 data provided by the NOAA/OAR/ESRL PSD, Boulder, Colorado, USA, from their Web site at http://www.esrl.noaa.gov/psd/
Thorne PW, Parker DE, Tett SFB, Jones PD, McCarthy M, Coleman H, Brohan P. 2005. Revisiting radiosonde upper air temperatures from 1958 to 2002. J. Geophys. Res . 110: D18105, DOI: 10.1029/2004JD005753
Trupin AS,Wahr JM. 1992. Spectroscopic analysis of global tide gauge sea level data. Geophysical Journal International 108: 115.
WGMS 2009: Glacier Mass Balance Bulletin No. 10 (2006-2007). W. Haeberli, I. Gärtner-Roer, M. Hoelzle, F. Paul, M. Zemp (eds.), (World Glacier Monitoring Service, Zurich, Switzerland, 2010). http://www.geo.unizh.ch/wgms/gmbb.html http://www.geo.unizh.ch/wgms/mbb/sum08.html
Willett, K.W., P.D. Jones, N.P. Gillett and P. W. Thorne, 2008: Recent changes in surface humidity: development of the HadCRUH dataset. J. Clim..21, 5364:5383. http://hadobs.metoffice.com/hadcruh/
Willis, J.K., D. Roemmich and B. Cornuelle (2004). Interannual variability in upper ocean heat content, temperature, and thermosteric expansion on global scales, J. Geophys. Res., 109, C12036, doi:10.1029/2003JC002260.
Woodworth P.L., White N.J., Jevrejeva S., Holgate S.J., Church J.A. and Gehrels W.R. (2008): Evidence for the accelerations of sea level on multi-decade and century timescales. International Journal of Climatology, 29(6), 777 789 doi:10.1002/joc.1771
Worley, S.J., S.D. Woodruff, R.W. Reynolds, S.J. Lubker, and N. Lott, 2005: ICOADS Release 2.1 data and products. Int. J. Climatol. (CLIMAR-II Special Issue), 25, 823-842 (DOI: 10.1002/joc.1166). http://ghrsst.nodc.noaa.gov/intercomp.html
Zou, C.-Z., M. Gao, M.Goldberg, 2009: Error structure and atmospheric temperature trends in observations of the microwave sounding unit, J. Climate, 22, 1661-1681. doi: 10.1175/2008JCLI2233.1
the microwave sounding unit, J. Climate, 22, 1661-1681. doi: 10.1175/2008JCLI2233.1
Commercial and media enquiriesYou can access the Met Office Customer Centre, any time of the day or night by phone, fax or e-mail. Trained staff will help you find the information or products that are right for you. |
 |
Maintained by: John Kennedy |
© Crown Copyright |