|
Decadal Trends of Specific Humidity in g/kg for the Period 1973 to 2003
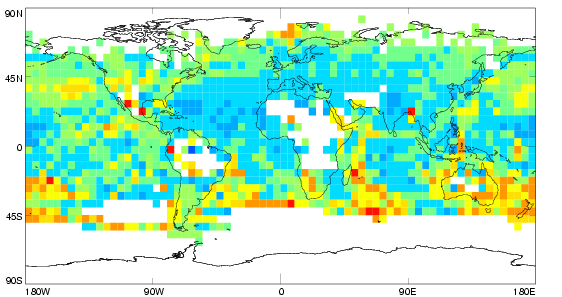

Decadal trends of surface specific humidity are shown. These have been calculated over the period 1973 to 2003 using a median pairwise technique. Significance is not shown.
Zonally Averaged Monthly Mean Anomaly Global Surface Specific Humidity and Decadal Trend in g/kg
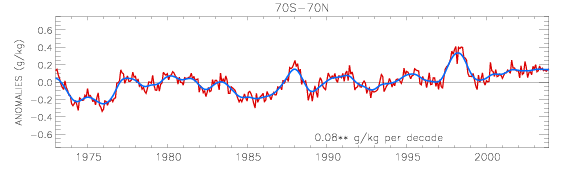
Zonally averaged monthly mean anomaly (relative to a 1974 to 2003 climatology) surface specific humidity for the Globe (70 °N to 70 °S) is shown in red. A 21 point Gaussian Smoothing Filter is shown in blue. The decadal trend is shown over the period of record with ** denoting significance at 1 %. The trend was estimated using the Restricted Maximum Likelihood method.
|
Commercial and media enquiriesYou can access the Met Office Customer Centre, any time of the day or night by phone, fax or e-mail.
Trained staff will help you find the information or products that are right for you. |
ReferencesWhen using the dataset please use the following three citations: Willett, K.W., P.D. Jones, N.P. Gillett and P. W. Thorne, 2008: Recent changes in surface humidity:
development of the HadCRUH dataset. J. Clim..21, 5364:5383.
3.4 Mb.
Other key references are: Willett, K.W.,2007: Creation and Analysis of HadCRUH: a New Global Surface Humidity Dataset, PhD Thesis, University of East Anglia, 199pp. |


